02 / 052026DESIGNED AND DEVELOPED END TO END
SCADA for telecommunications infrastructure
Central platform for supervising distributed electrical infrastructure, UPS units and generator sets in real time.
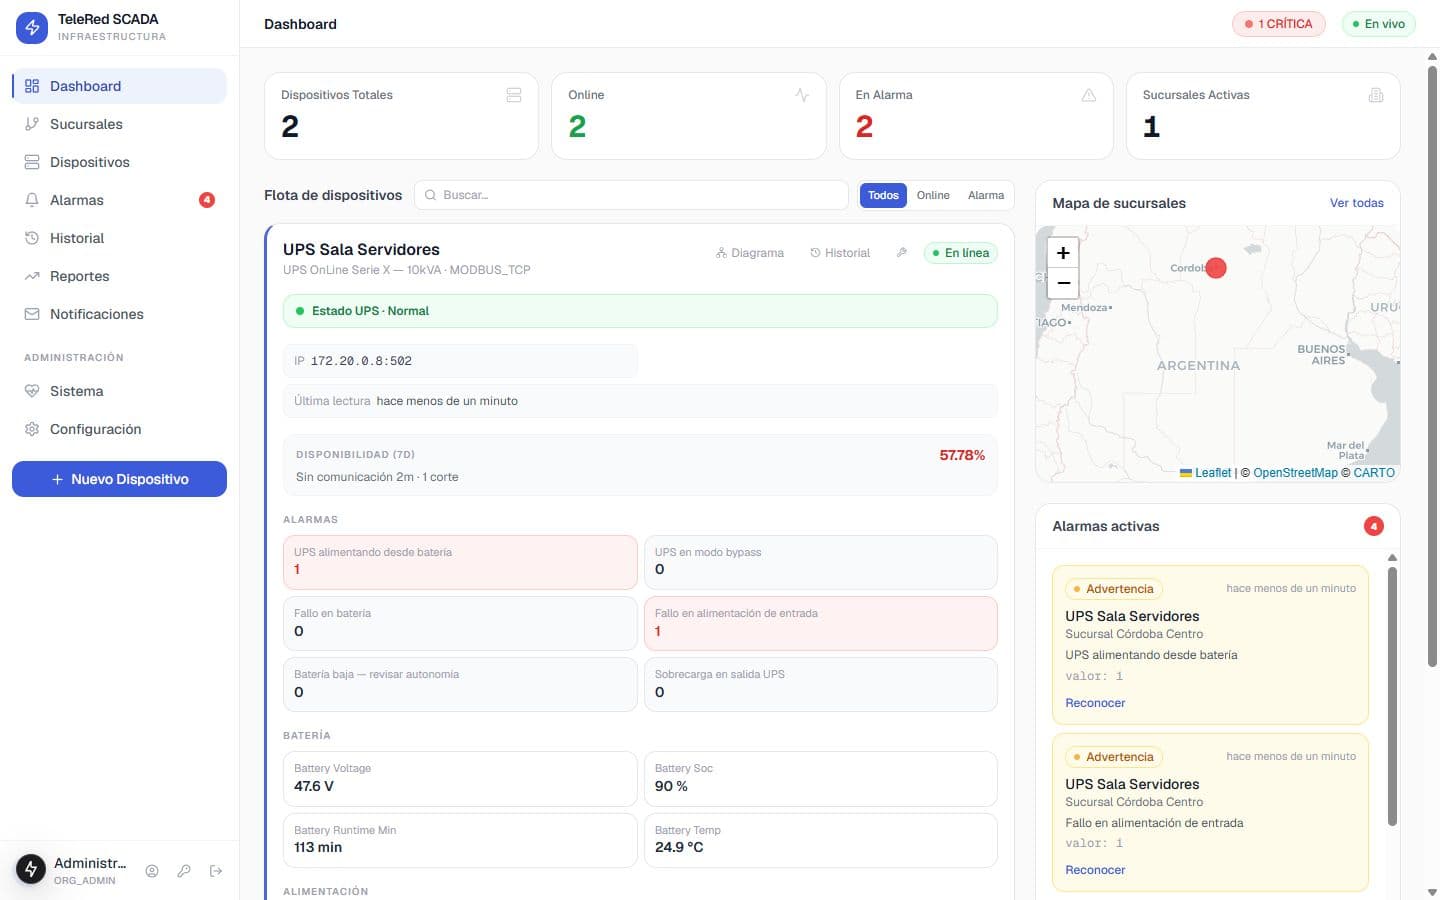
Real-time supervision with Modbus TCP acquisition, historical series, alerts, alarm acknowledgement and multi-site administration.
- YEAR
- 2026
- ROLE
- End-to-end development
- STATUS
- Documented case
Context
The electrical infrastructure behind a telecommunications network is distributed across many sites and devices. Without a central point, faults are detected late and technical history remains fragmented. On top of that there is the state of the sector's software: available SCADA platforms solve the technical side but carry interfaces from two decades ago, dense to read and hard to operate exactly when something is failing. This platform was built specifically for the client company, with the same technical depth and a current interface.
What I built
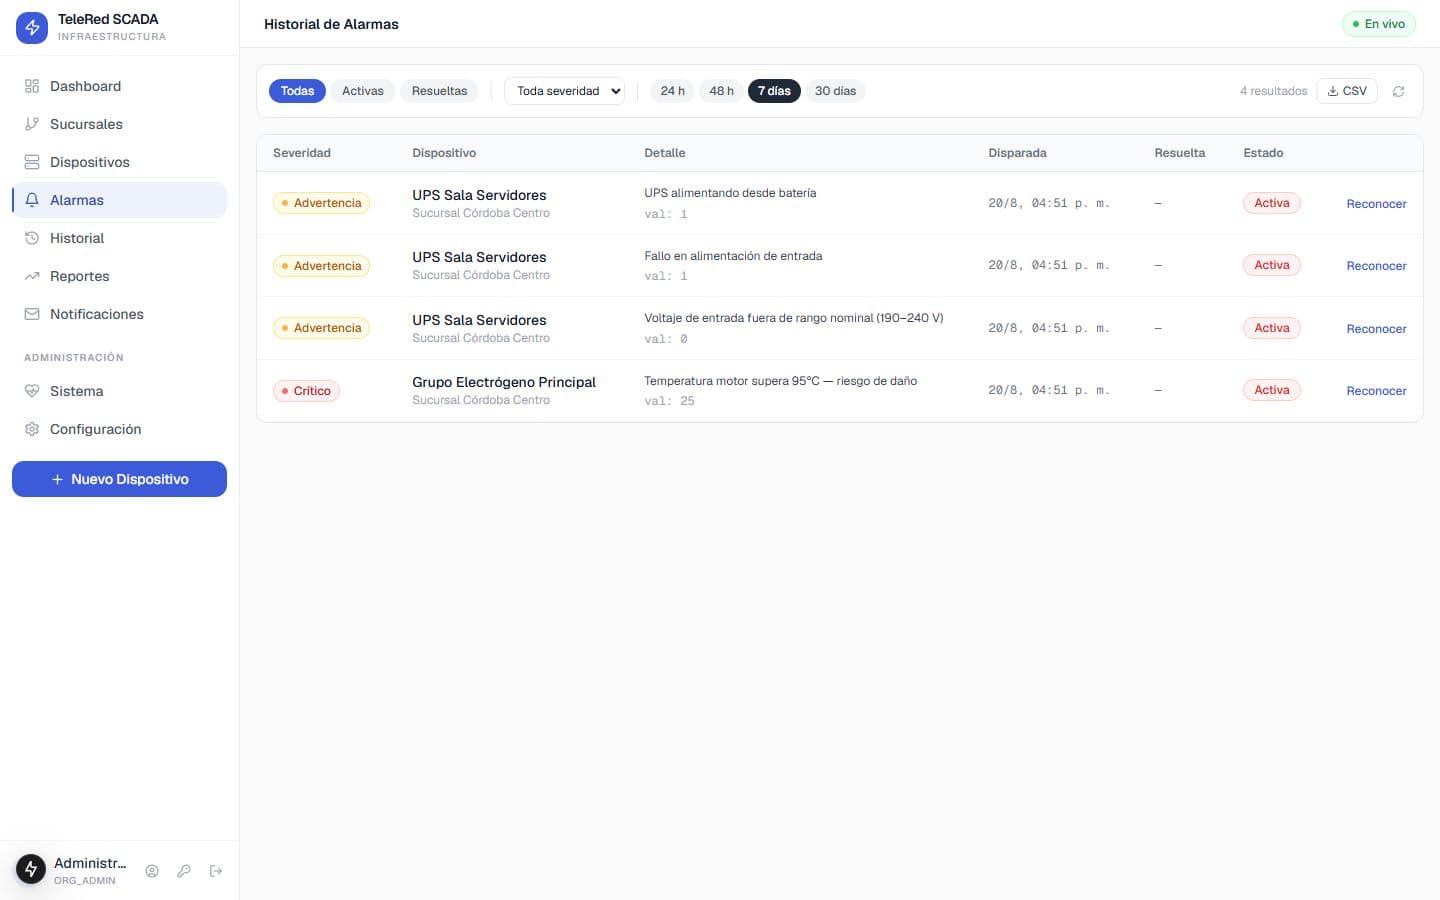
I developed the backend, frontend, Modbus TCP acquisition, time-series model, alert engine, notifications, API, maps, device panels, period charts and a simulator for testing without physical equipment.
How it works
A collector polls each device, normalises registers and writes measurements to TimescaleDB. Redis holds live state. Threshold crossings trigger alarms, WebSocket updates and notifications; acknowledgements are audited.
Features
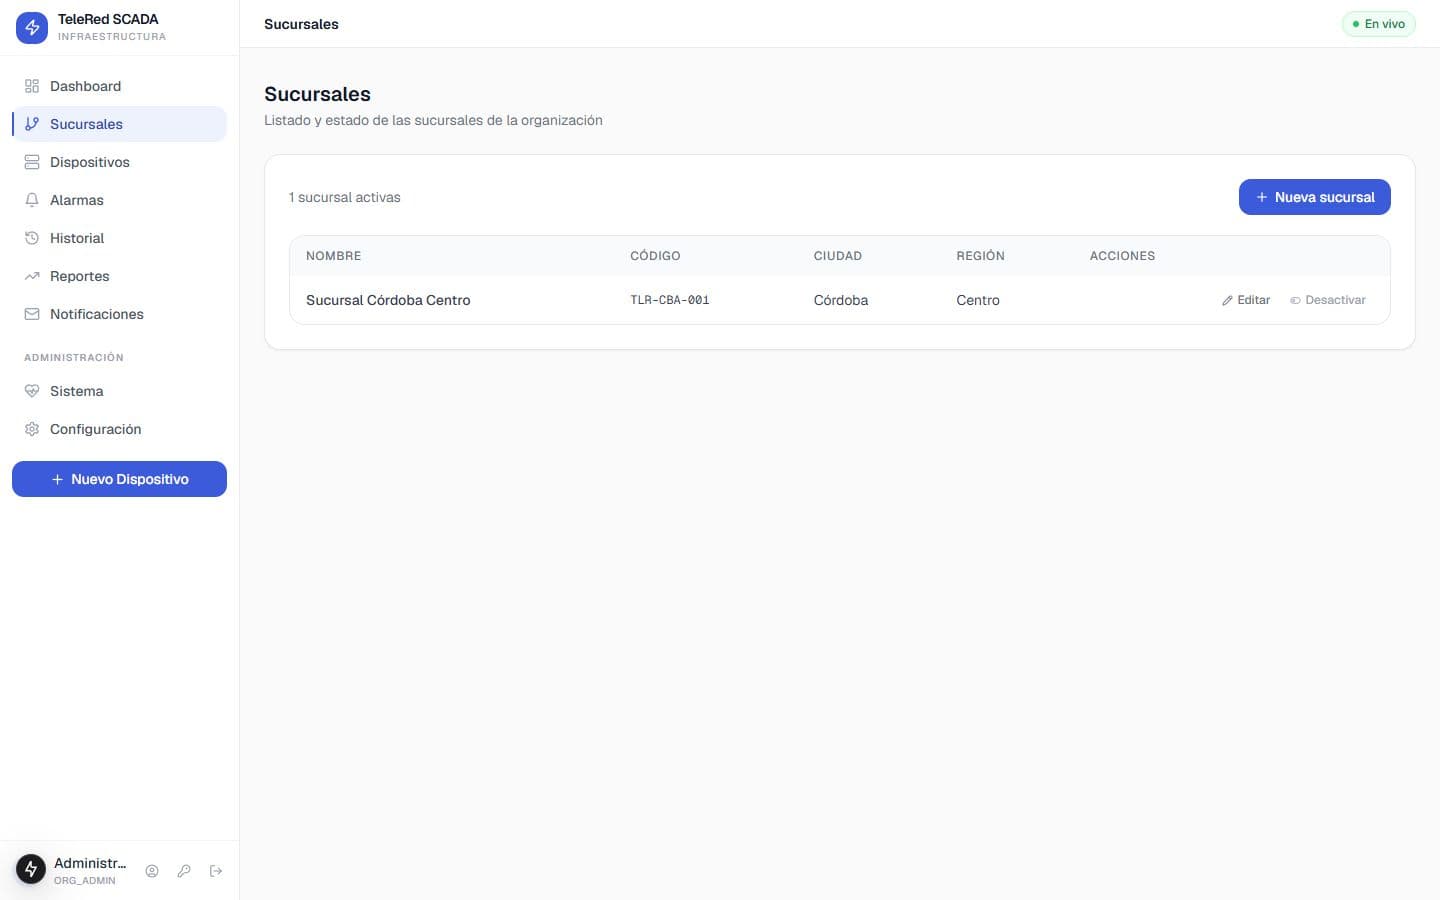
- Multi-site monitoring
- Modbus TCP communication
- SNMP-ready architecture
- Installation map
- Device panels
- Telemetry history
- Period charts
- Real-time alerts
- Alarm acknowledgement
- Email and Telegram
- CSV export
- Administration and audit
- Separate organisations
- Modbus simulator
Technical architecture
FastAPI and async SQLAlchemy on PostgreSQL/TimescaleDB, Redis for live state and messaging, Next.js with React and TypeScript, Zustand, Leaflet, ECharts and WebSockets. Docker deployment behind Nginx.
Technical decisions
The device model is decoupled from the protocol to add new equipment. Organisation separation starts in the database, and the simulator makes alert scenarios reproducible.
Privacy
Visible sites, devices, users, alarms and locations are fictional and shown in a local demo environment.
Frequently asked questions
What people usually ask.
What is this platform?
A SCADA supervising in real time the distributed electrical infrastructure of a telecommunications network: UPS units, generator sets and equipment across multiple sites.
How does it collect device data?
A collector polls each device over Modbus TCP, normalises its registers and writes measurements to TimescaleDB. Redis holds live state, and threshold crossings trigger alarms, WebSocket updates and email and Telegram notifications.
What sets it apart from a commercial SCADA?
Available platforms solve the technical side but carry interfaces from two decades ago, dense to read and hard to operate exactly when something is failing. This one was built specifically for the client company, with the same technical depth and a current interface.
What technologies is it built with?
FastAPI and async SQLAlchemy on PostgreSQL with TimescaleDB, Redis for live state, Next.js with React and TypeScript on the frontend, Leaflet for maps, ECharts for charts and WebSockets for real time. Deployed in Docker behind Nginx.
Technology stack
Gallery
The complete interface.
Private screenshots use fictional information.